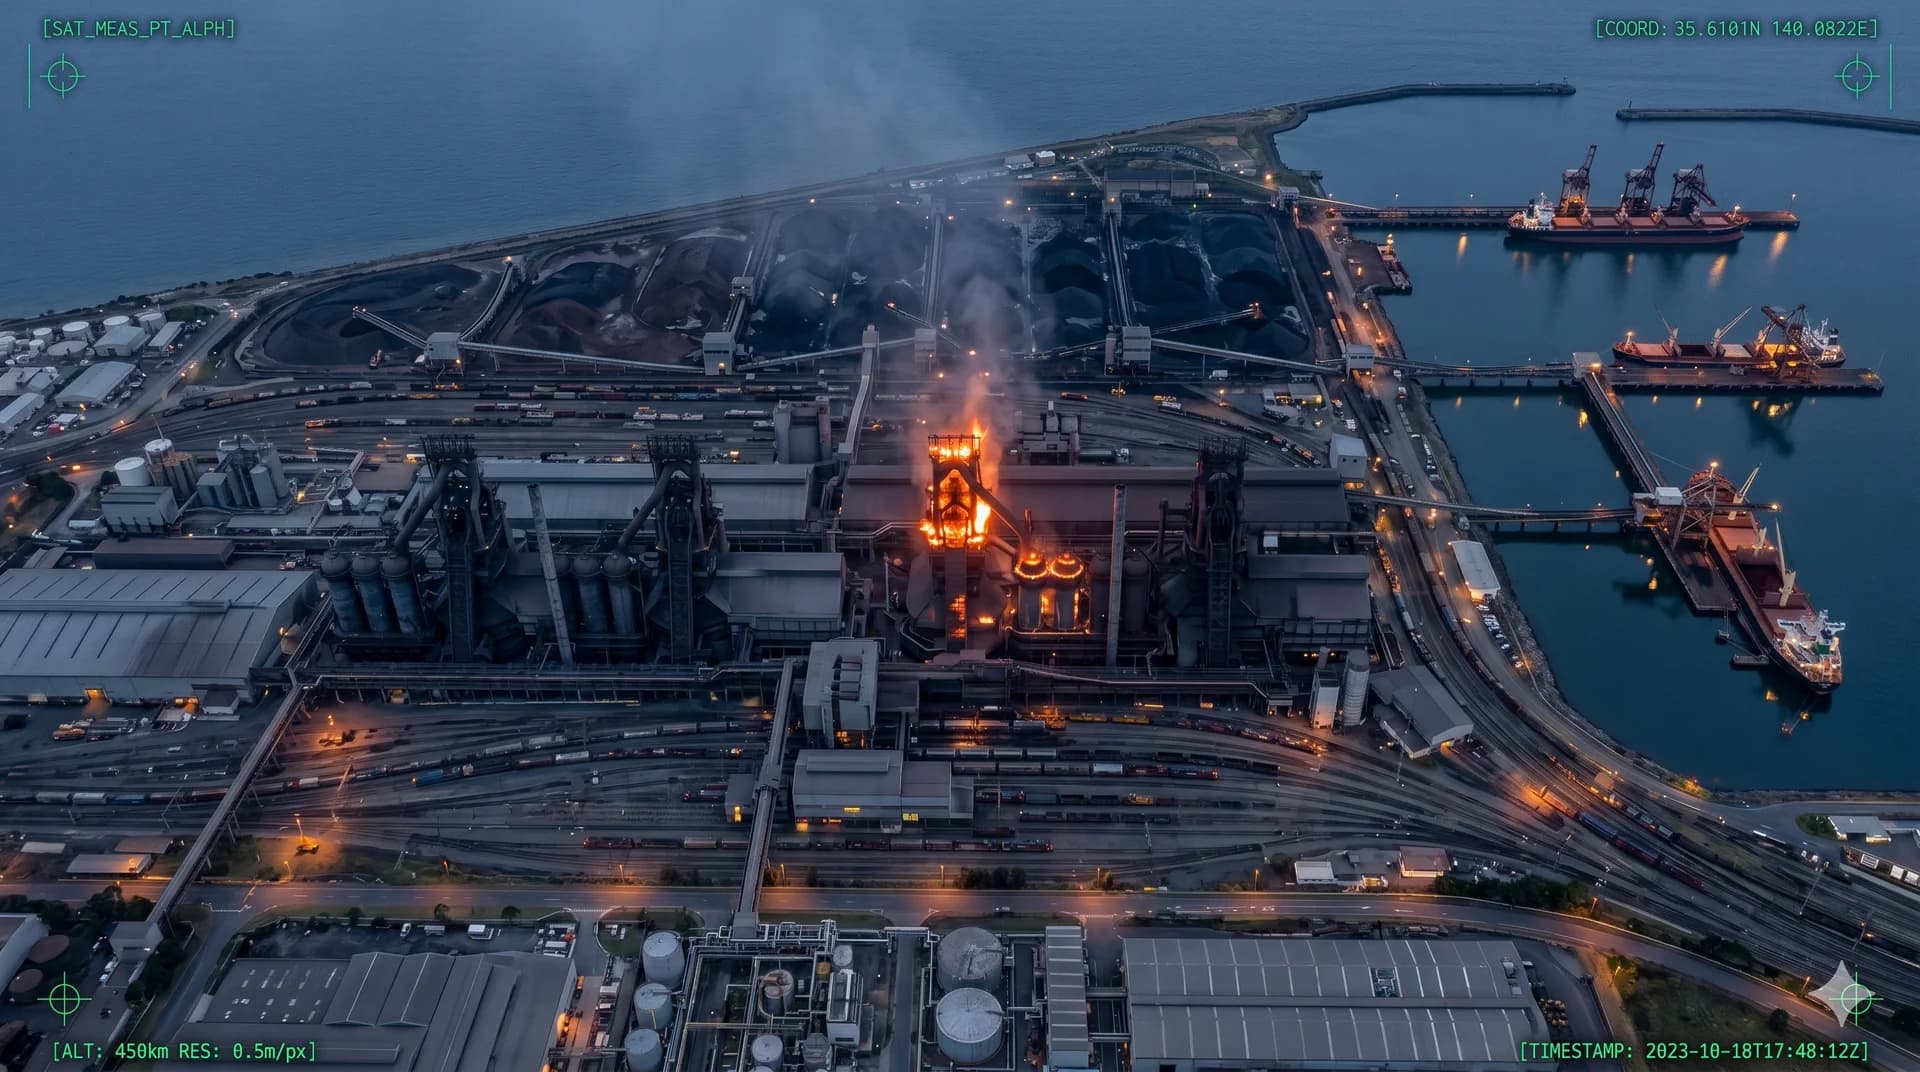
Floodlight and SatVu fused HotSat-1 thermal imagery with OCO-2 CO₂ retrievals at ArcelorMittal's Dunkerque steel plant. The combined signal traced blast-furnace shutdowns through 2023 and 2024 with no instrumentation on site.
When SatVu's thermal satellite caught Blast Furnace 1 going dark at ArcelorMittal's Dunkerque plant in March 2023, Floodlight's CO₂ measurements told the same story from a different orbit.
ArcelorMittal's Dunkerque plant in northern France has been producing steel since 1991. At full capacity, the facility turns out roughly seven million tonnes of finished steel a year. Like every blast-furnace integrated mill, it runs continuously when it is running, and the volume of CO₂ leaving its stacks tracks closely with how many furnaces are active and how hard they are being pushed.
That tight relationship between operations and emissions is what makes Dunkerque an ideal test case for satellite-based monitoring. If satellite observations can detect a change in furnace status from orbit, they can plausibly do the same across the rest of the world's heavy industry, where on-site instrumentation is uneven and self-reporting is not always timely. The research question Floodlight and SatVu set out to answer together was direct: do changes in the thermal profile of a facility correspond with measurable shifts in its CO₂ emissions?
SatVu's HotSat-1 satellite captures high-resolution thermal imagery, which made it possible to identify when individual blast furnaces at Dunkerque were running and when they were not. The thermal record showed that Blast Furnace 1 was permanently shut down on March 30, 2023, that Blast Furnace 3 went offline briefly and resumed in early April, and that Blast Furnace 4 stayed dark until October. With those operational timestamps in hand, Floodlight ran a top-down CO₂ analysis against the same windows.
The benchmark month was February 2023, before any of the shutdowns and well clear of any lingering COVID disruption. Floodlight processed an OCO-2 overpass for that period using its proprietary plume dispersion methodology, modeled the wind transport between the facility and the satellite sounding points, and arrived at a monthly emission estimate of 328,455 tonnes of CO₂. That figure became the all-furnaces-active baseline.
For the next test, Floodlight targeted June 2023, when Blast Furnace 1 was permanently offline and Blast Furnace 4 was also down. The same methodology returned 161,663 tonnes of CO₂ for that month, roughly half the baseline. The thermal data and the CO₂ measurements were telling the same story without sharing any source.
Finally, Floodlight ran the analysis for September 2024, after Blast Furnace 4 came back online. The result was 230,905 tonnes of CO₂, sitting between the two earlier readings exactly as the operational profile would predict.
The conclusion is straightforward but powerful. A facility's atmospheric signature shifts in lockstep with what happens inside the gate, and satellite measurements catch that shift with no instrumentation on site, no self-reporting, and no delay. For the next generation of MRV requirements, regulatory disclosures, and creditor due diligence in heavy industry, that signal-grade independence is the difference between a number that can be argued with and a number that cannot.
The Dunkerque analysis was carried out using publicly available OCO-2 satellite observations and SatVu's HotSat-1 thermal imagery. It demonstrates a methodology that Floodlight now applies routinely across cement, refining, chemicals, and other heavy-industry asset classes for institutional clients.
See how Floodlight can help your organization achieve similar results with our comprehensive climate risk intelligence platform.
