
SAGE
Directly Measured Emissions and Environmental Data
ECO-CITY
Directly measured Scope 1 + 2 Emissions, thermal measurements, and land cover changes for any municipality
Blockchain-Enabled Environmental Data
BEACON
Fully transparent accounting of environmental data for verification & validation
Sustainability Risks & Resilience for Real Estate
REST
Physical risks, climate risks, localized risks–for any location
Oil Pipeline Monitoring with Premier Satellite Imagery
CLEARLINE
Continuous monitoring of pipelines using optical satellite imagery, kilometer by kilometer, or by specific location.
SAGE: Greenhouse Gas Emissions Measurements for Single Assets, Companies & Portfolios
Our flagship product, SAGE, offers direct, asset-level measurements of greenhouse gas emissions for Scope 1 and 2 by combining satellite and sensor data with real-time monitoring technology. SAGE replaces traditional methods of estimation and manual data collection processes with highly accurate, transparent, and unbiased data. Its global network of sensors provides detailed insights into both acute and fugitive emissions, while supporting monthly and annual disclosures of total emissions in metric tons.
SAGE High Resolution Emissions Heat Map

Businesses, analysts, and asset managers use this data to assess the greenhouse gas emissions of individual properties for reporting, analysis, and benchmarking. The global sensor arrays provide comprehensive measurements and allow for pinpointing of acute, fugitive emissions as well as monthly and annual disclosures of total emission by metric tons when rolling up to the business level.
At its core, SAGE is a sophisticated scientific model that is built on transparency. It integrates diverse sources from satellites that measure GHG concentrations, to validation datasets that ensure product accuracy, and meteorology models that simulate gas movement-all fused together to pinpoint emissions from any facility.
Benefits
• Faster GHG inventories: What once took 4-12 months can now be completed in just days.
• Audit-friendly and ISO-certified: Ensures data meets the highest standards of accuracy and transparency. SAGE process is ISO 14064 certified.
• Audit-friendly and ISO-certified: Ensures data meets the highest standards of accuracy and transparency. SAGE process is ISO 14064 certified.
Features
• Asset-level precision: Pinpoints emissions down to a specific address or rolls up to the business level.
• Comprehensive emissions tracking: Accounts for both acute and fugitive emissions.
• Detailed GHG data: Breaks out different greenhouse gas types and provides data in metric tons of CO2e for reporting purposes.
• Comprehensive emissions tracking: Accounts for both acute and fugitive emissions.
• Detailed GHG data: Breaks out different greenhouse gas types and provides data in metric tons of CO2e for reporting purposes.
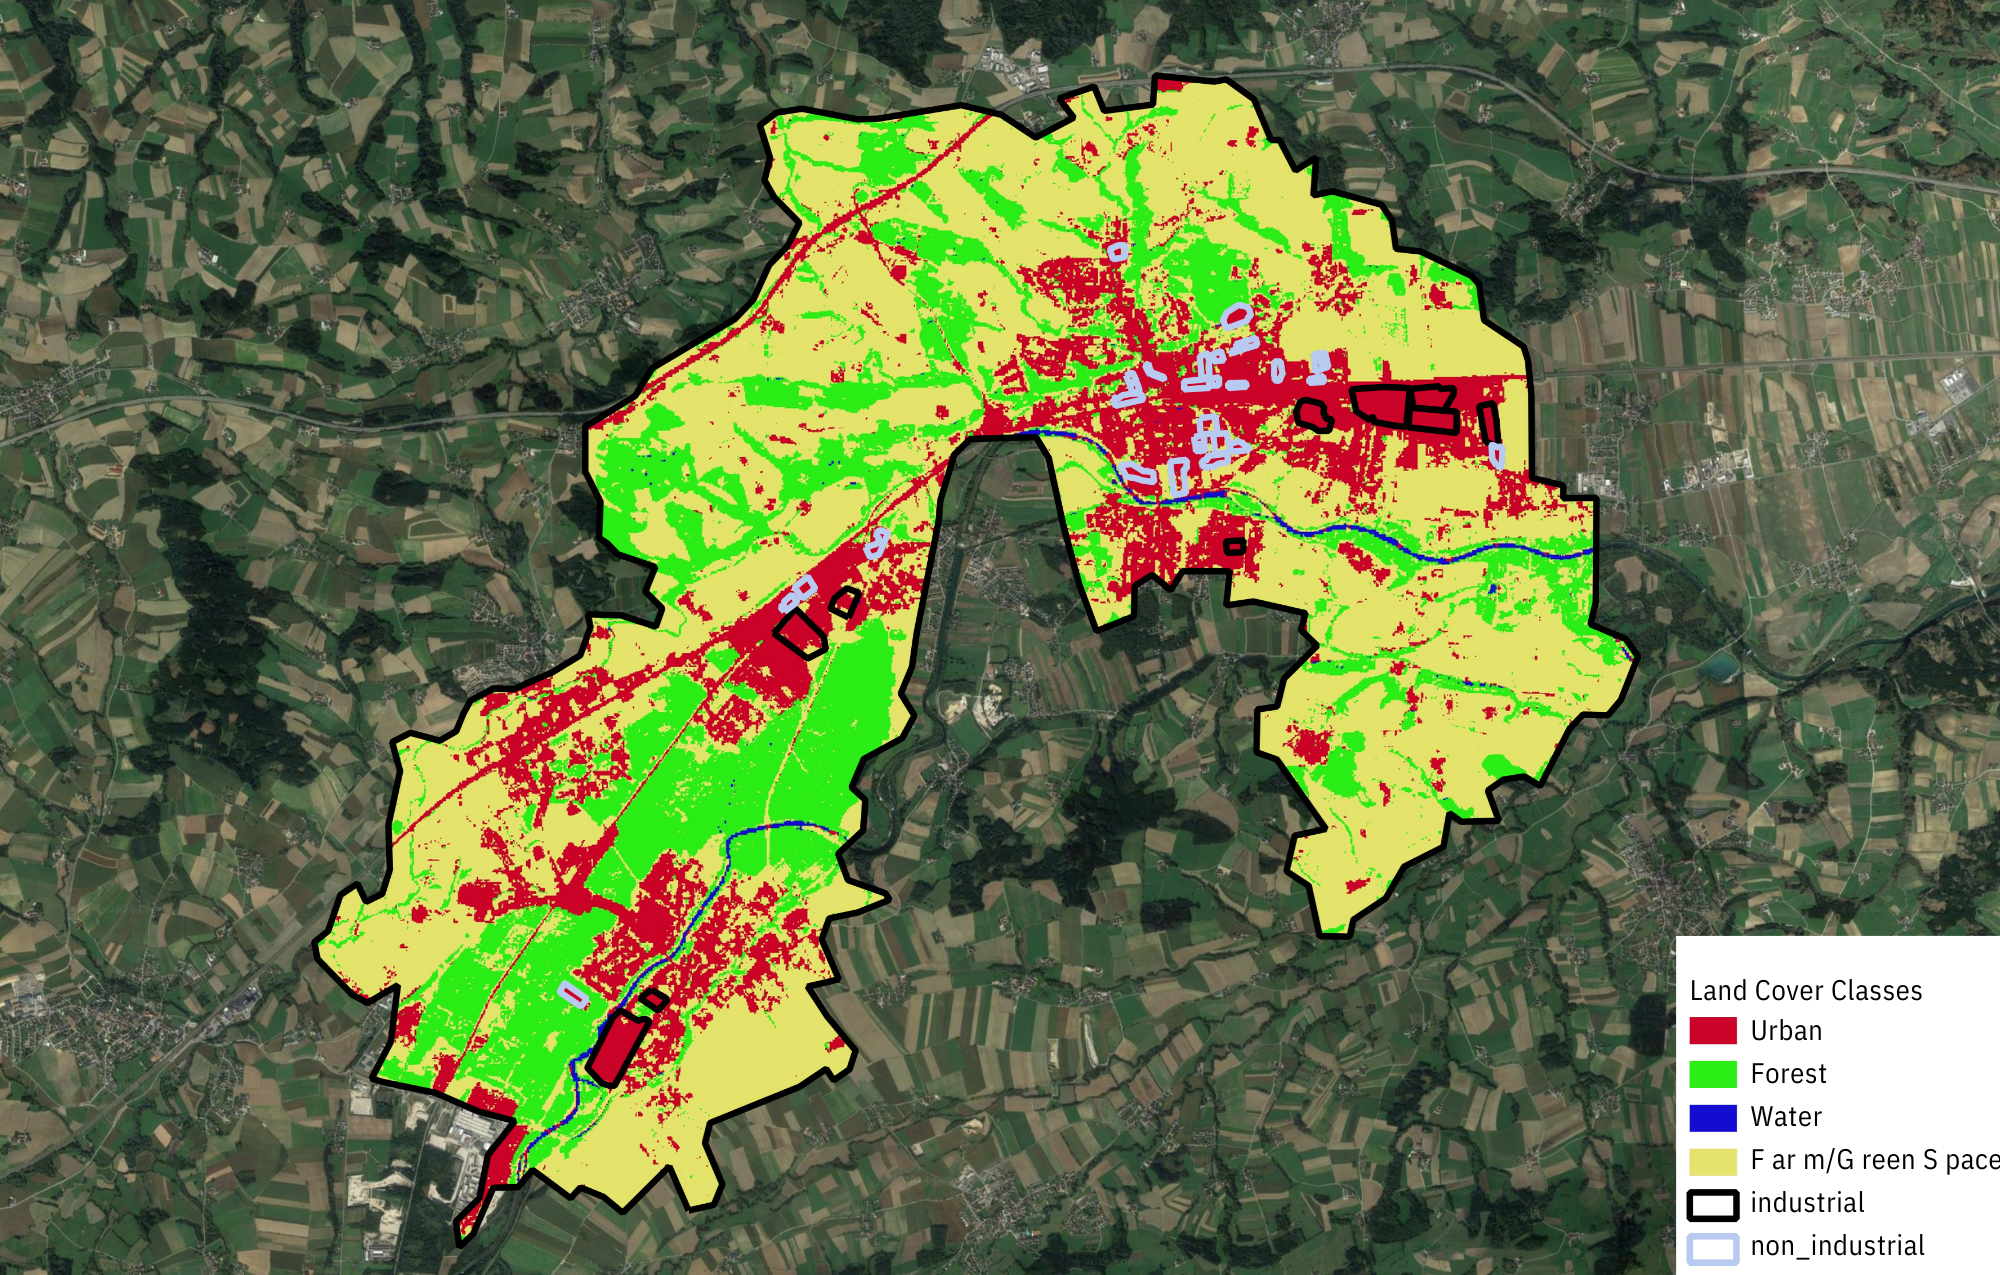
ECO-CITY: Greenhouse Gas Emissions Measurements and other Remotely Captured Environmental Data Points for Municipalities.
ECO-CITY borrows from the SAGE process by using satellite technology to measure GHG emissions for municipalities all over the world. ECO-CITY identifies top emitters across a industrial and non-industrial sectors. In addition, the product empowers decision makers who represent municipalities to make informed decisions with the highest quality environmental data from a variety of satellite sources.
ECO-CITY Land Cover
ECO-CITY Land Surface Temperature
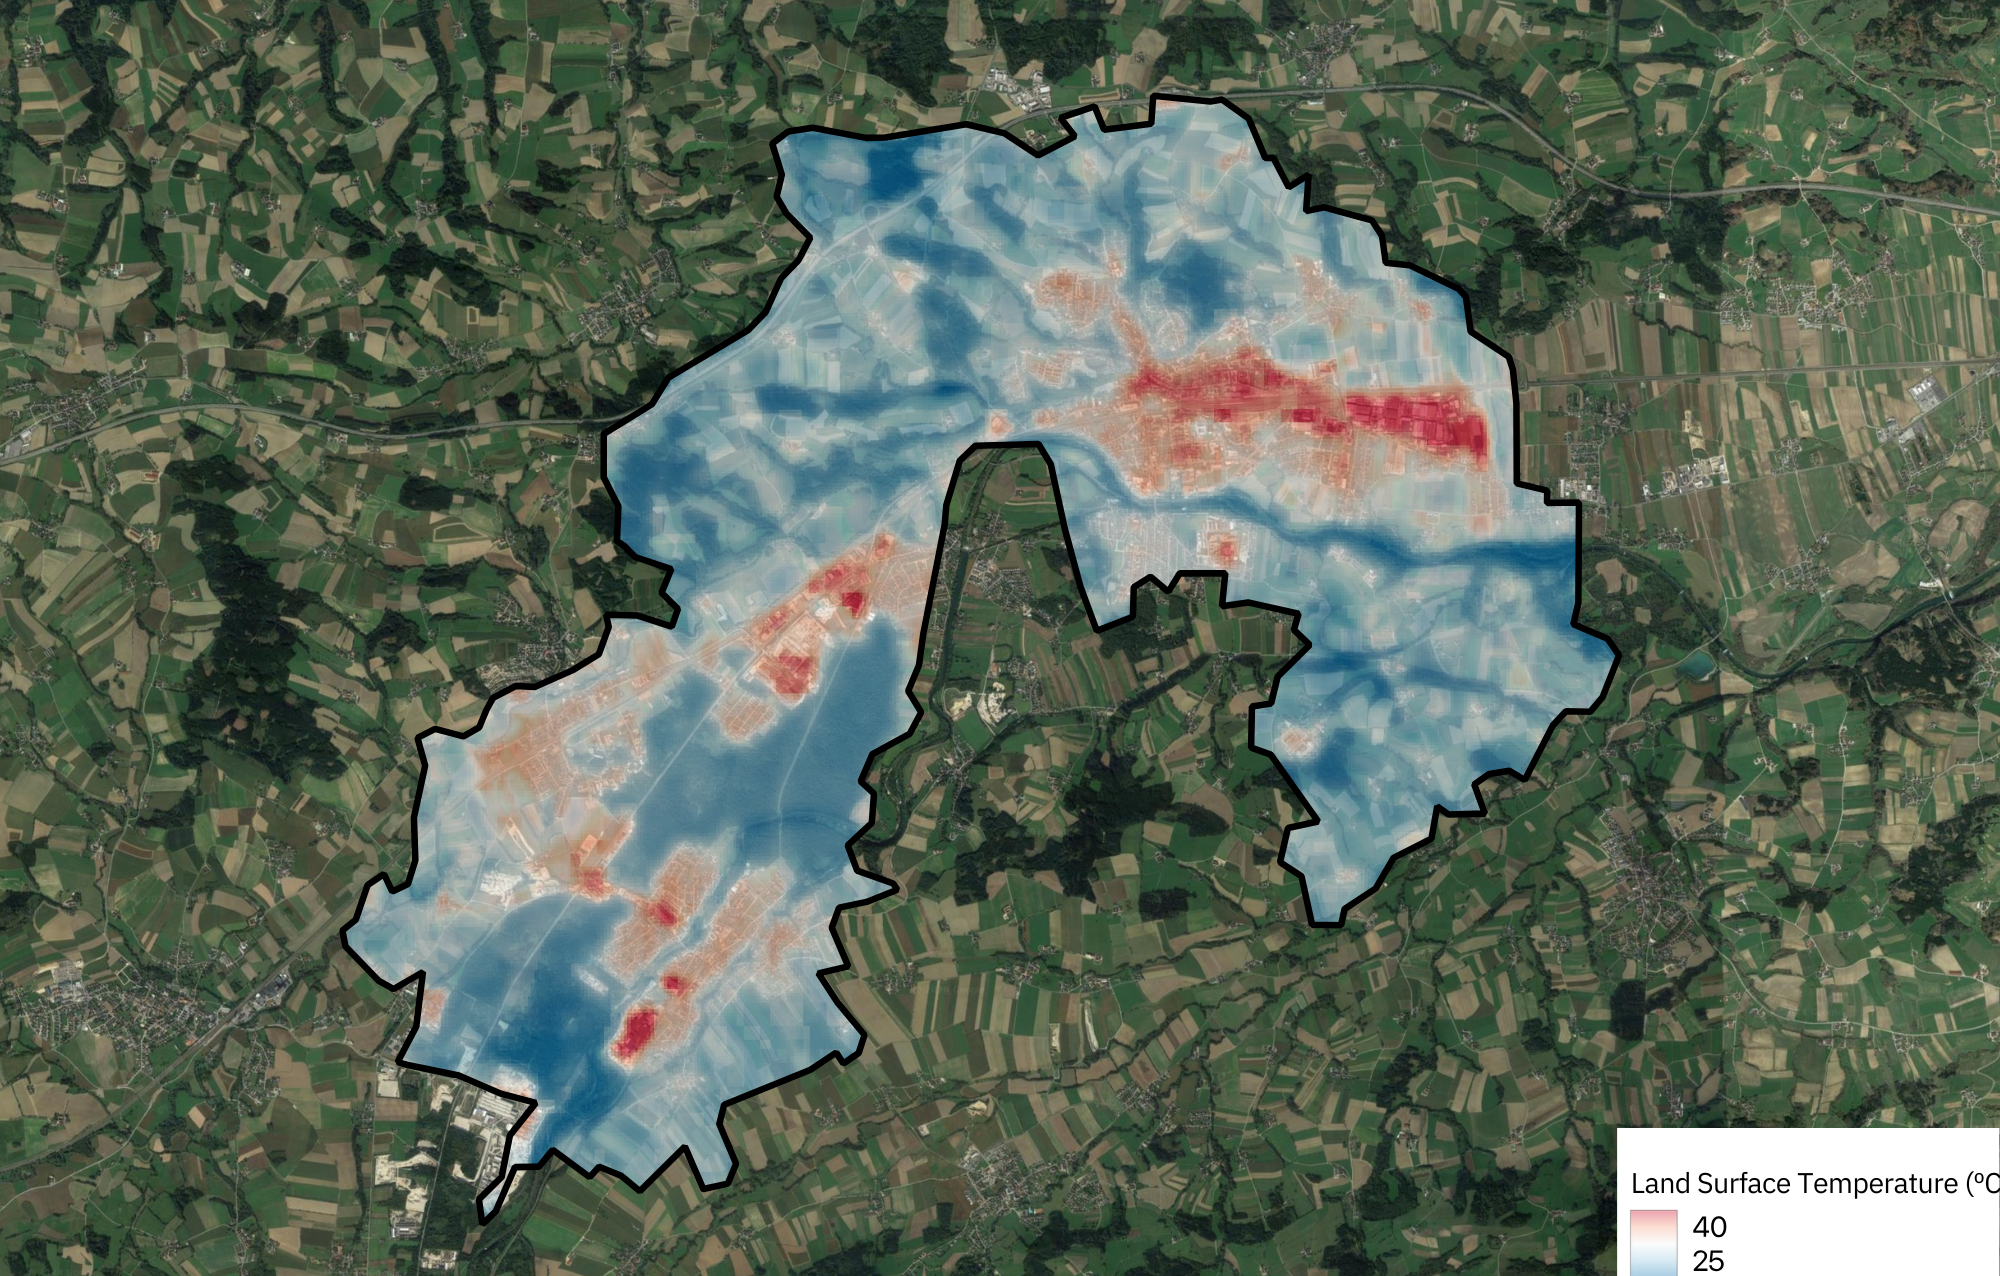
Additional data points for ECO-CITY include:
- Thermal Signatures/Land Surface Temperature (LST).
- Land Cover/Land Cover Changes.
- Scope 4
What is Scope 4?
Scope 4 can be defined as the avoided emissions. They are the result of smart environmental choices, technologies, or interventions.
For scope 4 of a municipality, Floodlight leverages high resolution satellite imagery to identify areas that are prime candidates for forestation or reforestation. By sampling nearby forested zones, Floodlight analysts are able to estimate the potential increase of carbon sequestration once the newly planted areas become mature.
Beyond carbon benefits, this approach also helps reduce the urban heat island effect, especially in densely developed areas, contributing to broader climate resilience.
Benefits
• Many Data Points to Pick: Although emissions are an important detail for municipalities, ECO-CITY allows customers to add more data to the analysis.
• High Resolution Images: In addition to the numbers, ECO-CITY provides powerful satellite-based images that tell the environmental story of your municipality.
• High Resolution Images: In addition to the numbers, ECO-CITY provides powerful satellite-based images that tell the environmental story of your municipality.
Features
• Time Series Capabilities: Analyze different years worth of data to track the progress your municipality has made.
• Detailed Reporting: Receive high level insights on each of the key data points
• Detailed Reporting: Receive high level insights on each of the key data points
BEACON: Blockchain-Enabled Environmental Data for Measurement, Reporting, and Verification
Carbon verification requires a multi-directional approach in order to provide robust, triple validation. Our first approach builds off our greenhouse gas data we use in our SAGE Product. SAGE provides a sensor based measurement of gas concentrations while allow us to understand the emissions–as well as sink of different gas profiles. This data, along with bio-data, such as tree types, species, biomass, paint a picture of the total carbon being captured (or emitted) for any 1×1 meter of the earth.
Using this approach, we provide a fully published, transparent accounting of the carbon trail published on blockchain (across several chains). These allow smart contracts and other Web 3.0 developers to access these data for usage in carbon accounting applications and for auditing purposes.
Benefits
- Monthly Measurements
- Global Federal Agency Validated
- Transparent, Science Based
- Peer Reviewed Approach and Publications
Features
- Global, 1×1 Meter Measurements
- Field and Parcel Level Reporting
- Biomass, Physical Risk Measures
- Delivered on Main and Test Nets Through Chainlink Nodes
REST: Real Estate Sustainability Tracking
Real Estate Sustainability Tool (REST) provides an asset-level view of physical risks, climate risks, emissions, and localized risk and resiliency scores for any address provided, globally. The data is sourced from satellite and remote sensing as well as government sources to provide a full chain of custody of the data. Methods are based on current science and methods, meaning no more guesswork and estimations.
The report provides an environmental assessment, including historical context so that any property can be evaluated and benchmarked. Suitable for individuals, investors, and other real estate professionals.

Benefits
- Due Diligence and Deal Speed, 48 hours
- Transparent and ISO 14091 Certified Data
- Science Based Methodology
- Full Report, Interactive Dashboard, and Raw Data for Any Integration
Features
- Any Address, Globally
- 15 Physical Risk Measures
- Local Risk and Resiliency Measures
- Greenhouse Gas Measurement and Benchmarks
- Local Demographics and Benchmarks
ClearLine: Rapid pipeline leak detection and environmental impact assessment from satellite imagery.
Detect leaks before they become disasters.
Floodlight’s pipeline monitoring system uses advanced optical satellite imagery to automatically identify signs of oil leaks.
The product is offered in two tiers:
• Tier 1 — Standard Monitoring
Uses medium-resolution (10 meter) optical imagery to routinely monitor pipeline corridors and nearby environments. This tier provides broad, cost-effective coverage and builds the foundation of your historical baseline.
• Tier 2 — Premium Monitoring
Delivers higher-resolution imagery (3.7 meter) for enhanced sensitivity, enabling earlier detection of smaller or localized leaks.
Both tiers use multi-temporal satellite data to establish a spectral baseline, creating a detailed reference of what an oil-free landscape looks like over time. Once this baseline is built, the system runs automatically, analyzing your pipeline kilometer by kilometer every month.
Any anomalies outside the established baseline are flagged for review by Floodlight analysts and shared with you. If oil is confirmed, a real-time alert is issued so your response team can act immediately, minimizing environmental and operational impacts.
Benefits
- Hands off Monitoring: Using satellite imagery reduces the cost and effort for finding leaks.
- Rapid Alerts: Fast acting alert system to reduce environmental impact.
- Reliable Assessments: Remote sensing data provides accurate analysis of damage in affected areas.
Features
- Consistent Data Streams: Imagery updated frequently, as much as near-daily for the premium offering.
- Analyst Expertise: Experienced analysts review areas triggered by the system to ensure there is a leak, reducing false positives.